Sometime ago I created a Tabulator App that took a Function F(x) = (string), a bunch of variables = values in a chr$(10) delimited string and xStart, xEnd, xInc like a For... Next Loop all these go into a TableIn.txt file that the Tabulator reads and produces a Table of x F(x) Data that could be read in by another bas app that needed the data for a function on the fly ie doesn't have to be formally defined in the app.
Then I made a demo of how to use the Tabulator and that was that, until now I have GUI.
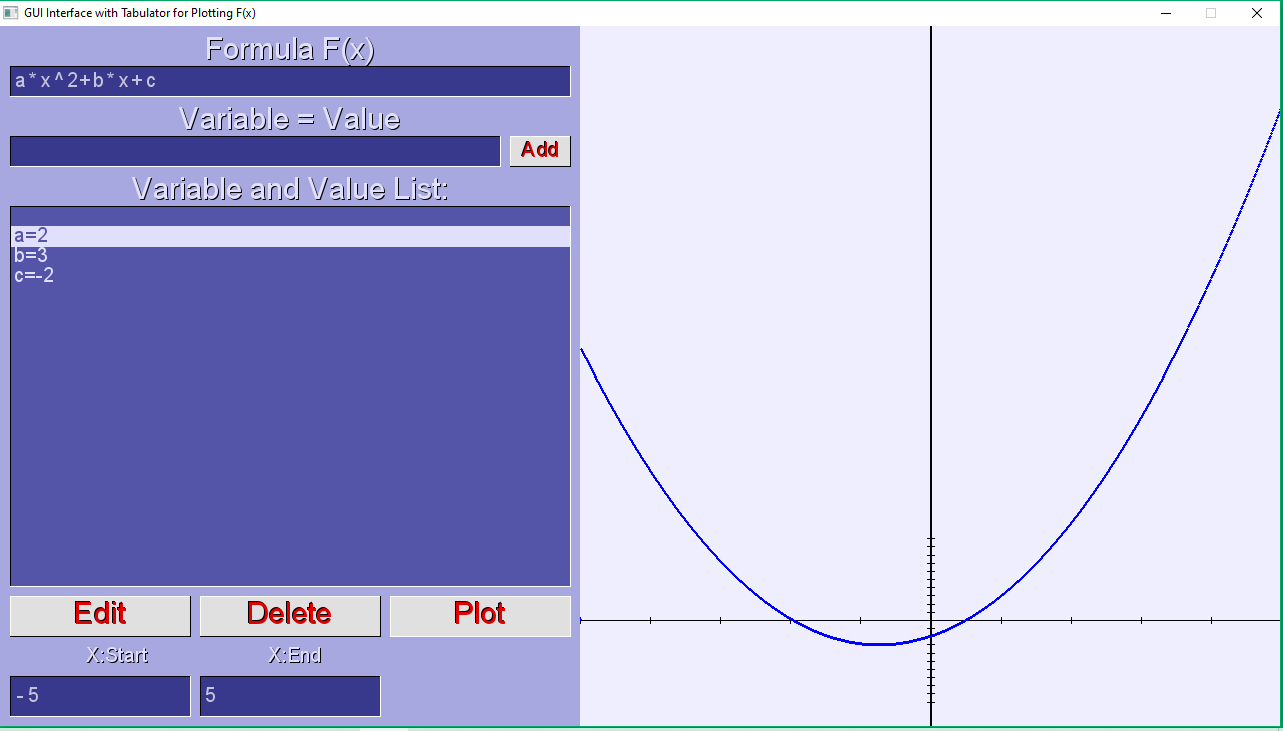
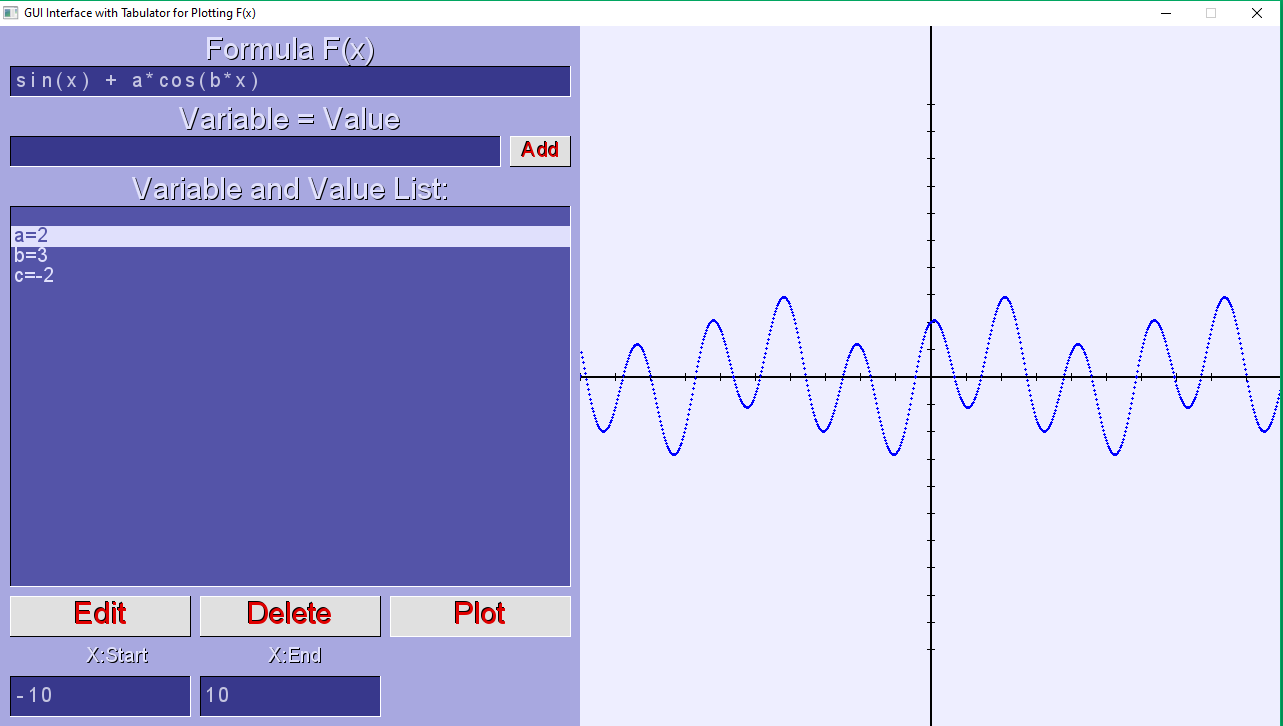
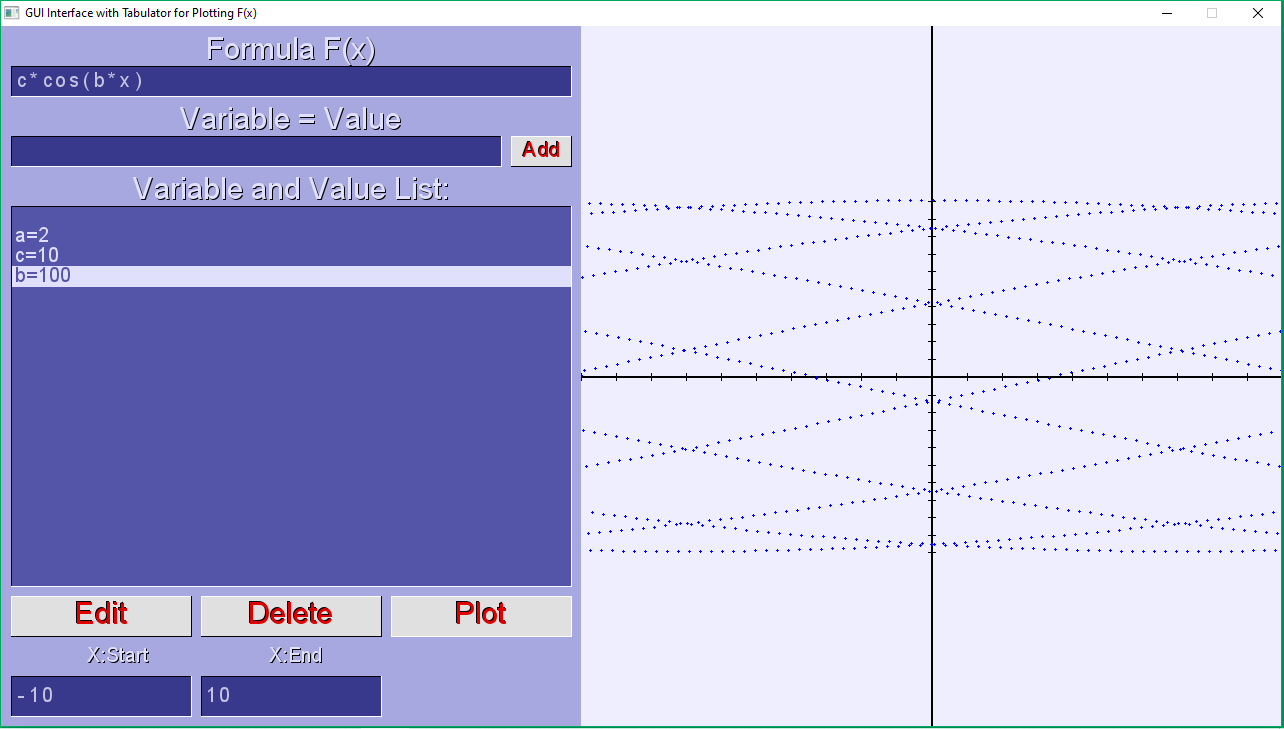
Now I can use GUI to Interface with the Tabulator and Graph Functions. Here are a few I tried tonight:
Simple Quadratic:

A trig function:

Another:

Here is the code for GUI:
And here is the zip with the Tabulator.exe for Windows so can run GUI right out of package if on Windows, otherwise compile for your OS before running GUI Interface. Again the Tabulator works with 2 simple files TableIn.txt and TableOut.txt. Included also is the Tabulator Demo for using in bas code.
Update 2022-07-17: I am updating the zip file with an improved plotting, drawing a line from last x to next, this radically changes the 3rd graph shown above without effecting the other 2.
Then I made a demo of how to use the Tabulator and that was that, until now I have GUI.
Now I can use GUI to Interface with the Tabulator and Graph Functions. Here are a few I tried tonight:
Simple Quadratic:
A trig function:
Another:
Here is the code for GUI:
Code: (Select All)
Option _Explicit ' _Title "GUI Interface with Tabulator for Plotting F(x)" ' b+ 2022-07-14


'$include:'vs GUI.BI'


'   Set Globals from BI

Xmax = 1280: Ymax = 700: GuiTitle$ = "GUI Interface with Tabulator for Plotting F(x)" ' <<<<<  Window size shared throughout program

OpenWindow Xmax, Ymax, GuiTitle$, "arial.ttf" ' need to do this before drawing anything from NewControls

' name = NewControl(0, 0, 0, 0, 0, 0, 0, 0, "text")

' GUI Controls

'                     Dim and set Globals for GUI app

Dim Shared As Long lbFx, tbFx, lbVV, tbVV, btAdd, lbVLst, lsVV, btEdit, btDelete, btPlot, lbx, tbStart, tbEnd, tbInc, pPlot

lbFx = NewControl(4, 10, 10, 560, 30, 30, 0, 0, "Formula F(x)")

tbFx = NewControl(2, 10, 40, 560, 30, 20, 0, 0, "")

lbVV = NewControl(4, 10, 80, 560, 30, 30, 0, 0, "Variable = Value")

tbVV = NewControl(2, 10, 110, 490, 30, 20, 0, 0, "")

btAdd = NewControl(1, 510, 110, 60, 30, 20, 0, 0, "Add")

lbVLst = NewControl(4, 10, 150, 560, 30, 30, 0, 0, "Variable and Value List:")

lsVV = NewControl(3, 10, 180, 560, 380, 20, 0, 0, "")

btEdit = NewControl(1, 10, 570, 180, 40, 30, 0, 0, "Edit")

btDelete = NewControl(1, 200, 570, 180, 40, 30, 0, 0, "Delete")

btPlot = NewControl(1, 390, 570, 180, 40, 30, 0, 0, "Plot")

lbx = NewControl(4, 10, 620, 550, 30, 20, 0, 0, "X:Start                    X:End                           ")

tbStart = NewControl(2, 10, 650, 180, 40, 20, 0, 0, "")

tbEnd = NewControl(2, 200, 650, 180, 40, 20, 0, 0, "")

'tbInc = NewControl(2, 390, 650, 180, 40, 20, 0, 0, "")

pPlot = NewControl(5, 580, 0, 700, 700, 0, 999, 0, "")

' End GUI Controls


MainRouter ' after all controls setup


'  EDIT these to your programs needs

Sub BtnClickEvent (i As Long) ' attach you button click code in here

    Dim item$

    Select Case i

        Case btAdd

            If _Trim$(con(tbVV).Text) <> "" Then

                If _Trim$(con(lsVV).Text) <> "" Then

                    con(lsVV).Text = con(lsVV).Text + "~" + _Trim$(con(tbVV).Text)

                Else

                    con(lsVV).Text = con(tbVV).Text

                End If

                con(tbVV).Text = ""

                drwTB tbVV, tbVV = ActiveControl

                drwLst lsVV, lsVV = ActiveControl

            End If

        Case btEdit

            ReDim lst(1 To 1) As String

            Split con(lsVV).Text, "~", lst()

            item$ = lst((con(lsVV).N1 - 1) * con(lsVV).N4 + con(lsVV).N2)

            con(tbVV).Text = item$

            drwTB tbVV, tbVV = ActiveControl

            Remove item$, lst()

            con(lsVV).Text = Join$(lst(), "~")

            drwLst lsVV, tbVV = ActiveControl

        Case btDelete ' what is the highlited

            ReDim lst(1 To 1) As String

            Split con(lsVV).Text, "~", lst()

            item$ = lst((con(lsVV).N1 - 1) * con(lsVV).N4 + con(lsVV).N2)

            Remove item$, lst()

            con(lsVV).Text = Join$(lst(), "~")

            drwLst lsVV, 0

        Case btPlot

            ' make call to Tabulator (in Shell)

            ReDim As Long j

            Dim xStart, xEnd, yMin, yMax, dx, y(700), dy, x, y

            Dim fx$

            ReDim lst(0)

            xStart = Val(_Trim$(con(tbStart).Text)): xEnd = Val(_Trim$(con(tbEnd).Text))

            dx = (xEnd - xStart) / 700: fx$ = _Trim$(con(tbFx).Text)

            Split con(lsVV).Text, "~", lst()

            item$ = Join$(lst(), Chr$(10)) ' reusing something already DIM's this is our variable list delimited by chr$(10)

            ReDim arr$(0)

            If dx = 0 Then Cls: Print "dx = 0": End

            forXEqual xStart, xEnd, dx, fx$, 0, item$, arr$() ' 0 = using radians for trig

            ' hopefully arr$ has the data we need to make our plot


            'debug

            'item$ = Join$(arr$(), Chr$(10)) ' debug

            'mBox "Our Data Array", item$ ' debug   with 700 items in table probably don't want to check in mbox


            ' need to find min, max y and convert values to number

            For j = 0 To 700

                y(j) = Val(_Trim$(RightOf$(arr$(j), " ")))

                If j = 0 Then

                    yMax = y(j): yMin = y(j)

                Else

                    If y(j) < yMin Then

                        yMin = y(j)

                    ElseIf y(j) > yMax Then

                        yMax = y(j)

                    End If

                End If

            Next j

            yMin = yMin - 10

            yMax = yMax + 10

            dy = yMax - yMin

            If dy <> 0 Then ' dont divide by 0

                _Dest con(pPlot).N1

                Line (0, 0)-Step(con(pPlot).W - 1, con(pPlot).H - 1), &HFFEEEEFF, BF


                If 0 >= xStart And 0 <= xEnd Then

                    Line (700 * (0 - xStart) / (xEnd - xStart), 0)-Step(0, 700), Black ' y axis

                    For y = -10 To 10

                        Line (700 * (-xStart) / (xEnd - xStart) - 3, 700 - 700 * (y - yMin) / (yMax - yMin))-Step(6, 0), Black

                    Next

                End If


                If 0 >= yMin And 0 <= yMax Then

                    Line (0, 700 - 700 * (0 - yMin) / (yMax - yMin))-Step(700, 0), Black ' y axis

                    For x = -10 To 10

                        Line (700 * (x - xStart) / (xEnd - xStart), 700 - 700 * (0 - yMin) / (yMax - yMin) - 3)-Step(0, 6), Black ' y axis

                    Next

                End If

                For j = 0 To 700

                    Circle (j, con(pPlot).H - 1 - 700 * (y(j) - yMin) / dy), 1, &HFF0000FF

                    PSet (j, con(pPlot).H - 1 - 700 * (y(j) - yMin) / dy), &HFF0000FF

                Next

                _Dest 0

                _PutImage (con(pPlot).X, con(pPlot).Y)-Step(con(pPlot).W, con(pPlot).H), con(pPlot).N1, 0

            End If


    End Select

End Sub


Sub LstSelectEvent (control As Long)

    Select Case control

    End Select

End Sub


Sub PicClickEvent (i As Long, Pmx As Long, Pmy As Long) ' attach your Picture click code in here

    Select Case i

    End Select

End Sub


Sub PicFrameUpdate (i As Long) ' attach your Picture click code in here

    Select Case i

    End Select

End Sub


Sub forXEqual (start, toFinish, incStep, formula$, dFlag As Long, variablesCHR10$, outputArr$())

    Dim fLine$

    If _FileExists("TableOut.txt") Then Kill "TableOut.txt"

    Open "TableIn.txt" For Output As #1

    Print #1, _Trim$(Str$(start))

    Print #1, _Trim$(Str$(toFinish))

    Print #1, _Trim$(Str$(incStep))

    Print #1, formula$

    Print #1, TS$(dFlag)

    Print #1, variablesCHR10$

    Close #1

    ReDim outputArr$(0)

    Shell _Hide "Tabulator.exe"

    _Delay .5 ' sometimes it compiles in time sometimes not, 3 reduces the nots

    If _FileExists("TableOut.txt") Then

        Open "TableOut.txt" For Input As #1

        While Not EOF(1)

            Line Input #1, fLine$

            sAppend outputArr$(), fLine$

        Wend

        Close #1

    End If

End Sub


''append to the string array the string item

Sub sAppend (arr() As String, addItem$)

    ReDim _Preserve arr(LBound(arr) To UBound(arr) + 1) As String

    arr(UBound(arr)) = addItem$

End Sub


'$include:'vs GUI.BM'
And here is the zip with the Tabulator.exe for Windows so can run GUI right out of package if on Windows, otherwise compile for your OS before running GUI Interface. Again the Tabulator works with 2 simple files TableIn.txt and TableOut.txt. Included also is the Tabulator Demo for using in bas code.
Update 2022-07-17: I am updating the zip file with an improved plotting, drawing a line from last x to next, this radically changes the 3rd graph shown above without effecting the other 2.
b = b + ...


